Introduction
The economic theory of ‘free market’ competition naturally achieving lower electricity prices in restructured electric utility states is empirically tested in restructured states, pre-and-post restructuring, relative to U.S. electricity prices. Whether electricity consumers are better or worse off – as a result of electric utility restructuring – is answered here.
The vertically-integrated government-regulated natural monopoly electric utility model worked well in the U.S. – for nearly 100 years. However, some governors and state legislatures wish to reduce their states’ electricity prices and are advised that electricity prices would naturally fall if ‘free market’ competitive marketplaces were established.
Consequently, beginning in the late 1990s, a limited number of states restructure their vertically-integrated government-regulated natural monopoly electric utilities – by instituting “free market” competition in the electricity generation and retail sales’ sectors – while maintaining the middle-two sectors of transmission and distribution as a government-regulated natural monopoly.
Data and Method
U.S. Energy Information Administration (EIA) is the source of electric power price data for this study, from 1970-through-2011, both for the restructured electric utility states and for the U.S. electrical power system.
EIA identifies 15 states, plus the District of Columbia (D.C.), that are in different stages of restructuring their electricity markets – and explains that “restructuring means that a monopoly system of electric utilities has been replaced with competing sellers,” and also states that ‘restructured states’ may be referred to as ‘deregulated states.’ Illinois, Ohio, Michigan and Pennsylvania severely limit their electricity market restructuring during this 1970-2011 study period, and consequently, are not included in states that have effectively restructured their electricity markets.
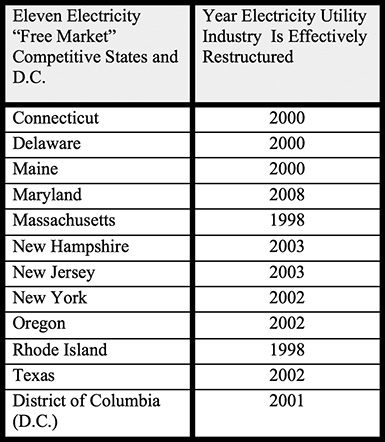
The 11 states and the D.C. that effectively restructure their vertically-integrated government-regulated natural monopoly electric utilities, and offer ‘free market’ competitive marketplaces – and the year their electric utility industry is effectively restructured – are listed in Table 1.
Table 1: Eleven States and the D.C. Offering Consumers ‘Free Markets’ and Effective Year Restructured
Means testing is used to statistically analyze electricity prices, from 1970 to 2011, for states that restructure their electric utilities – pre-and-post restructuring – relative to U.S. electricity prices; thus determining whether restructured electricity utility states are more or less efficient, after restructuring, than before.
Results
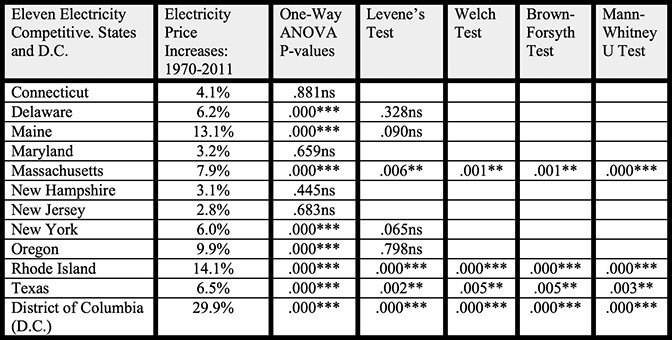
United States electricity prices increased 4.0 percent a year, from 1970 through 2011, denoted by its linear least squares trend line. During the same time, electricity prices for the 11 effectively restructured states and the D.C.’s mean increase is 8.9 percent a year, as shown in Table 2, by state. The effectively restructured 11 states and D.C. (restructured states) electricity prices rose about 220 percent faster than U.S. electricity prices, from 1970 to 2011.
U.S. electricity prices and electricity prices in each of the restructured states change yearly. To discover when electricity prices are rising fastest in the restructured states, relative price changes are computed. U.S. electricity prices are subtracted from the electricity prices in each of the restructured states, for each year, from 1970 through 2011. By comparing relative electricity price sample means for the U.S. and the restructured states, pre-and-post restructuring for each state, it is determined if electricity prices in the restructured states are increasing significantly faster after restructuring, than before restructuring, relative to U.S. electricity prices.
One-way ANOVA p-values – testing between group means for each ‘free market’ competitive state’s regulated vs. restructured data sets – and Levene’s, Welch, Brown-Forsyth and Mann-Whitney U tests’ significance levels are shown, where required, in Table 2.
Table 2: One-way ANOVA—Testing Between Group Means for Each ‘Free Market’ Competitive State

Levene, Welch, Brown-Forsyth and Mann-Whitney U test significance levels are shown, where required.
*** extremely significant at p < .001; ** very significant at p < .01;
* significant at p < .05; ns - not significant at p ≥ _.05
Levene’s tests for Delaware, Maine, New York and Oregon are not significant;
therefore, no difference between population variances is assumed, and no further statistical tests are required.
Of the 11 states and the District of Columbia (D.C.) that have effectively restructured their electricity markets and allow ‘free market’ competition, electricity prices have gone up over four times faster, after restructuring than before restructuring, relative to U.S. electricity prices. Delaware, Maine, New York, Oregon, Rhode Island and the D.C. have extremely significant electricity price increases and are extremely less efficient, after their electric utilities restructure.
Massachusetts and Texas have very significant electricity price increases and are very less efficient, after their electric utilities restructure. Connecticut, Maryland, New Hampshire and New Jersey have no significant relative price increases, pre-and-post restructuring; however, these four states retain substantial price-suppression regulation, through re-regulation of their electricity marketplaces. No effectively restructured electric utility state is statistically more efficient.
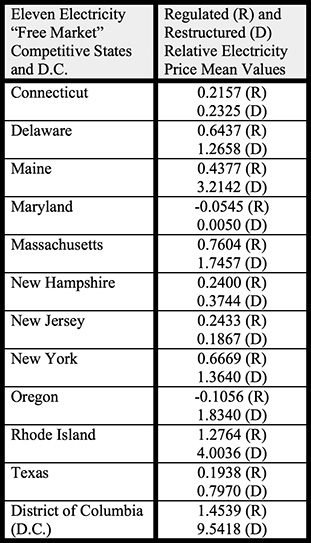
The relative electricity price mean values for each ‘free market’ competitive state, pre-and-post restructuring, are listed in Table 3.
Table 3: Relative Electricity Price Mean Values for Each ‘Free Market’ Competitive State
The relative electric power price means for restructured states, prior to restructuring, totals 5.9717, and after electric utility restructuring is 24.5647. Relative to U.S. electricity prices, from 1970 to 2011, the restructured ‘free market’ competitive states have electricity prices, during their restructuring periods, increase over four times faster than increases in electricity prices prior to their restructurings. Extremely significant and very significantly higher relative electricity prices, evident after electric utility restructurings in eight restructured states, are an increased burden on electricity customers—placing these eight restructured states at a competitive disadvantage when attracting new jobs and industries.
Conclusions and Policy Implications
The economic theory of ‘free market’ competition naturally achieving lower electricity prices in restructured electric utility states is empirically tested. U.S. Energy Information Administration (EIA) is the source of electric power price data for this study, from 1970 through 2011, which are analyzed using one-way ANOVA means testing for electric utility restructured states, pre-and-post restructuring, relative to U.S. electricity prices.
The results presented do not support the economic theory that ‘free market’ competitive marketplaces naturally achieve lower prices, in the electric power industry. Instead, electric company operating efficiencies are extremely and very significantly reduced in many restructured states, making society poorer.
‘Free market’ economic theory is not being appropriately applied to electric utility restructuring. Unique technical and organizational limitations may be the reasons. Empirical evidence does not support the energy policy of additional states restructuring their electric utilities, using the existing market design. What is important is developing and implementing an appropriate economic policy that realistically assesses the unique organizational and technical limitations in the vertically-integrated government-regulated natural monopoly electric power industry.
This article draws from Eric L. Prentis’ 2015 International Journal of Energy Economics and Policy publication, entitled, “Evidence on U.S. Electricity Prices: Regulated Utility vs. Restructured States.”
About the Author
 Eric L. Prentis, Ph.D., is a Registered Professional Engineer (I) with ten years of industry project management experience: including eight years in the engineering, design, construction and start-up of nuclear power plants, and two years on petrochemical plants. Dr. Prentis teaches in the MBA program at the University of St. Thomas, Houston, TX.


