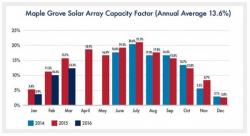
After almost two years of collecting output data and other information from the Maple Grove and 19 member cooperative arrays, Great River Energy's generation engineers have a better idea of what the Land of 10,000 Lakes is capable of in terms of solar energy production.
Great River Energy's 250-kilowatt (kW) research and demonstration array at its Maple Grove headquarters tests the performance of three types of panels, while the 19 arrays across Greater Minnesota have a generating capacity of 20 kW each and provide statewide distributed generation information. All of the projects are helping Great River Energy and its member cooperatives evaluate the impact of solar energy while providing up to 450,000 kilowatt-hours of renewable energy annually - equivalent to powering about 38 homes.

The most data has been collected from the Maple Grove array, since it was completed in May 2014. The member projects wrapped up just after the fall season in 2015 with arrays installed in cities as north as Lutsen and as south as Worthington.
Andy Bergrud, a senior engineering project manager at Great River Energy, notes that one of the main findings is that the Maple Grove array is representative of the average annual performance of the member sites.
"The statewide average is very similar to Maple Grove's output," Bergrud said. "As expected, the southern arrays perform slightly better than the northern arrays, but the difference in annual capacity factor from the Maple Grove site has only been about half a percent."
The Maple Grove array's annual capacity factor average is 13.6 percent, which falls in between the installations at Cooperative Light and Power (13.2 percent) in Two Harbors, and Goodhue County Cooperative Electric Association (14.2 percent) in Zumbrota. These percentages indicate how much energy output the panels produced, on average, compared to their full nameplate capacity throughout the year.
Bergrud noted that the Maple Grove array saw a slightly better summer performances in its second year of operation, which may have been caused by less cloud cover in the sunnier months. The array saw 17 percent "ideal" days in 2015 - those days with sunshine and clear skies - versus 10 percent in 2014. Also in 2015 were less recorded "erratic" days - when clouds either don't clear out or cover the sun on and off throughout the day. That percentage went down from 70 percent in the array's first year to 62 percent in year two.
"These figures still represent that our ideal days are a low minority of the time," Bergrud noted. "Knowing this information helps us from a grid management perspective in understanding how solar production tends to behave in our region."
The Maple Grove array's time-of-day generation percentages are also representative of the 19 member projects. In the summer months, solar production begins at about 6 a.m., exponentially increases throughout the morning and early afternoon (peaking at 13.75 percent at noon) then it tapers off during the early evening, with no production after 7 p.m.
Overall, Bergrud said, the average annual output for each of the arrays is slightly lower than the 15 percent capacity factor expectation they had going into the projects, but it represents "one of the realities of solar in Minnesota." One of the project team's biggest takeaways going into the third year of solar generation on the Great River Energy system is how much of an effect frequent, rapid power swings have on the output - again, due to Minnesota's tendency to have more cloudy days over pure sunny days. An understanding of the sudden shifts in power output caused by cloud interference is an important lesson learned for utilities to find ways to properly manage the grid as more solar and other renewable energy resources are interconnected to the electric system.


