
Introduction
The U.S. hydropower fleet has been providing clean, reliable power for more than a hundred years. However, no systematic documentation existed of the U.S. fleet and the trends influencing it in recent years. The Hydropower Market Report seeks to fill this gap and provide industry and policy makers with a quantitative baseline on the distribution, capabilities, and status of hydropower in the United States. Since 2014 there have been four complete editions of the report with the most recent edition focusing on updated data from 2020-2022. The report contextualizes information compared to evolving high-level trends over the past 10-20 years. In intervening years, updated summarizations and data are published on HydroSource .
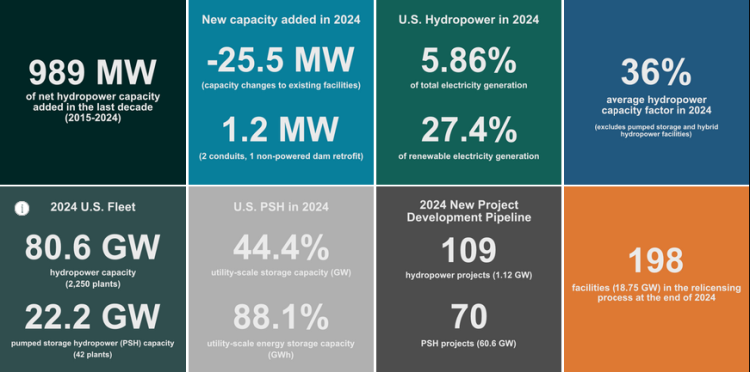
Key Statistics
U.S. Hydropower Development Pipeline, 2025
At the end of 2024, there were 78 non-powered dams, 23 conduits, and 8 new stream-reach development projects in various stages of the development pipeline with a combined capacity of 1.12 GW.
- Non-powered dam (NPD) retrofits account for 72% of the proposed new capacity.
- Seven of the eight new stream-reach developments (NSD) proposed are in Alaska.
- One proposes building an impoundment dam.
- Sixty-six of the projects in the pipeline have already received federal authorization; seven of them have reached the construction stage (2 NPD and 5 conduits (C)).
- Of the ~411 MW capacity additions in the pipeline, 394 MW result from upgrades to existing turbine-generator units rather than new units being installed.
- Click on the map and hover over projects to find more information. Click on the region labels to filter. Click on the bars in the lower left to highlight the corresponding projects.
Sources: ORNL U.S. Hydropower Development Pipeline Data 2025 , FERC eLibrary, IIR
Click here to read the full report.
