
This is the latest installment in a series highlighting data visualizations created by ISO New England to help explain different aspects of the region's bulk electric system.
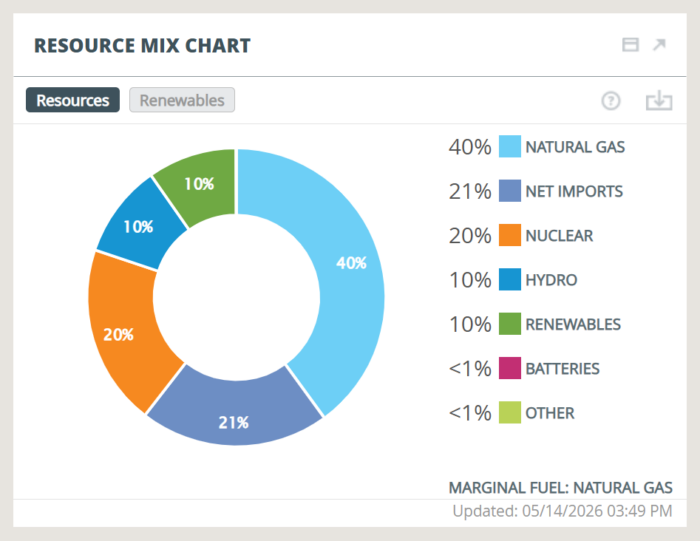
Batteries form a small but growing share of the resources providing energy to the New England grid. And for the first time, that share is now represented in the Resource Mix Graph and Resource Mix Chart on ISO Express, and our mobile app, ISO to Go.
Although batteries today typically provide less than 1% of the region's energy, the ISO expects that number to increase in the coming years. Five years ago, proposals for new battery resources represented about 17% of submissions in the queue for interconnection studies technical analyses the ISO performs to ensure resources can receive transmission service reliably. Today, that share is around 45%.
As described in a previous installment of this series, the Resource Mix graph and chart show the resources meeting consumer demand for grid electricity in real time. Besides batteries, the charts include coal, hydro, natural gas, net imports from neighboring regions, nuclear, oil, renewables, and other, which includes demand response. A resource type may appear in the legend but not in the charts if it is producing a very low amount of electricity. If a resource type is not producing any electricity, it will not appear at all.
ISO to Go users will need to update the app to see the latest changes.
